Although most laptops and desktops have switched to solid-state drives (SSDs), which are much faster than traditional hard drives (HDDs), a certain amount of read and write operations will occur regardless of storage technology. These operations, depending on the application and task at hand, can impact performance.
If you want to check drive activity to understand performance or troubleshoot storage-related issues in Windows 11, you can use Task Manager and Performance Monitor to view transfer rates, response times, and other information in real time.
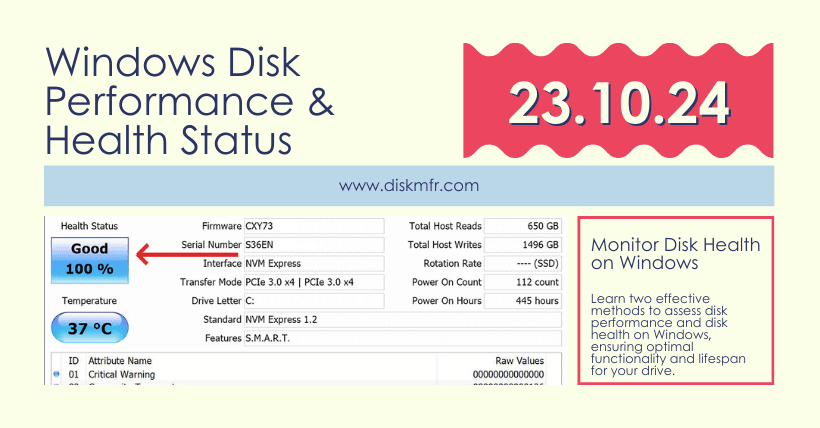
Today, I’ll introduce two simple ways to check drive performance, and you can follow these steps to test it.
01
Monitoring Drive Activity with Task Manager
To check drive activity using Task Manager, follow these steps:
- Open Task Manager.
- Click “Performance” from the left pane.
- Select the drive from the left.
- Check the “Active Time” section to view the read/write percentage over time (updated every 60 seconds).Tip: This information is also reflected in the main “Active Time” graph.
- Check the “Average Response Time” information to see the time it takes for the hard drive or SSD to respond to read/write requests from the operating system.
- Check the “Read Speed” and “Write Speed” to determine the current speed of the drive (in KB or MB per second).Tip: This information is also reflected in the main “Disk Transfer Rate” graph.
02
Monitoring Drive Activity with Performance Monitor
To monitor drive activity using the traditional Performance Monitor application, use these steps:
- Search for “Resource Monitor” and open the application.
- Click the “Disk” tab.
- In the “Processes with Disk Activity” section, review the read/write speed (in bytes per second) of processes currently or recently using disk resources.
- Click “Disk Activity.”
- Review the read/write speed of each system process.
- In the “Disk Activity” tab header, check the total number of operations per second (IOPS) or bandwidth.
On the right, you can also find a graph for each drive on your computer. The top graph shows the drive’s IOPS, and the Queue Length graph provides an indication of drive performance.
For example, a high queue length indicates that the disk is overloaded and unable to keep up with incoming read/write requests. This means that many requests are waiting to be processed, leading to delays, which is usually associated with slow drive performance.
On the other hand, a low queue length usually indicates that the disk is efficiently handling read/write requests. Few or no requests are waiting to be processed, allowing programs to access data quickly. A low queue length generally indicates good drive performance.
Be aware that a hard drive that is too full can significantly reduce performance. Typically, once storage capacity reaches 70%, you should start freeing up space or consider upgrading to a larger drive.

Disclaimer:
- This channel does not make any representations or warranties regarding the availability, accuracy, timeliness, effectiveness, or completeness of any information posted. It hereby disclaims any liability or consequences arising from the use of the information.
- This channel is non-commercial and non-profit. The re-posted content does not signify endorsement of its views or responsibility for its authenticity. It does not intend to constitute any other guidance. This channel is not liable for any inaccuracies or errors in the re-posted or published information, directly or indirectly.
- Some data, materials, text, images, etc., used in this channel are sourced from the internet, and all reposts are duly credited to their sources. If you discover any work that infringes on your intellectual property rights or personal legal interests, please contact us, and we will promptly modify or remove it.