01
Preface
Some time ago, we shared numerous performance reviews of the GeForce RTX 5060 Ti 16GB, but those were mostly horizontal comparisons conducted at 1080P or 1440P resolution against competing products.
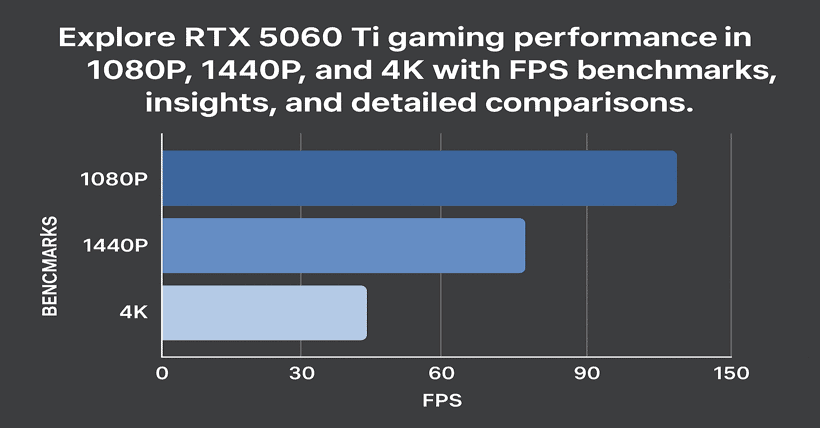
Today, we’ll perform a vertical performance comparison of the GeForce RTX 5060 Ti 16GB. In other words, we’ll run the same game using this graphics card at four different settings—1080P, 1440P, standard 4K, and 4K with DLSS enabled—to evaluate its actual performance.
02
Test Platform Configuration
The main specifications are as follows:
Processor: Ryzen 5 9800X3D
Motherboard: ASRock X670E PG Lightning
Memory: 32GB DDR5 6000MHz
Graphics Card: GeForce RTX 5060 Ti 16GB
SSD: ADATA XPG 1TB GAMMIX S70 Blade
Operating System: Windows 10
03
RTX 5060 Ti Game Testing
The classic game Red Dead Redemption 2 was used for testing at 1080P max settings, 1440P max settings, standard 4K max settings, and 4K max settings with DLSS enabled.
Round 1 – 1080P Max Settings
- Average FPS: 99
- Minimum instantaneous FPS: 67
- Frame time: 9.3ms
- CPU Usage: 49%
- CPU Power: 62W
- CPU Temp: 54°C
- Memory Usage: 12.7GB
- GPU Usage: 97%
- VRAM Usage: 5.7GB
- GPU Power: 114W
- GPU Temp: 58°C
Under this setting, CPU usage hovers around 50%, memory usage ranges between 12–13GB, GPU is nearly fully utilized, and VRAM usage is between 5–6GB. Average FPS reaches around 100, with minimum FPS over 60, and frame time around 9ms.
Round 2 – 1440P Max Settings
- Average FPS: 85
- Minimum instantaneous FPS: 48
- Frame time: 12.3ms
- CPU Usage: 25%
- CPU Power: 56W
- CPU Temp: 54°C
- Memory Usage: 13.0GB
- GPU Usage: 98%
- VRAM Usage: 6.5GB
- GPU Power: 128W
- GPU Temp: 61°C
Here, CPU usage drops to around 25%, memory usage is about 13GB, GPU nearly fully utilized, and VRAM usage increases by about 1GB compared to 1080P. Average FPS is over 80—roughly 10 FPS lower than 1080P (a 14% drop). Minimum FPS is over 40—about 19 FPS lower, with frame time increased by about 3ms.
Round 3 – Standard 4K Max Settings
- Average FPS: 46
- Minimum instantaneous FPS: 34
- Frame time: 20.2ms
- CPU Usage: 12%
- CPU Power: 46W
- CPU Temp: 54°C
- Memory Usage: 13.4GB
- GPU Usage: 99%
- VRAM Usage: 7.3GB
- GPU Power: 140W
- GPU Temp: 61°C
At this setting, CPU usage drops to around 12%, memory usage just above 13GB, GPU is fully loaded, and VRAM usage exceeds 7GB. Average FPS is over 40—about 46% lower than 1440P. Minimum FPS is above 30—14 FPS lower than 1440P. Frame time increases by about 8ms.
Round 4 – 4K Max Settings + DLSS (Quality Mode)
- Average FPS: 64
- Minimum instantaneous FPS: 36
- Frame time: 14.2ms
- CPU Usage: 19%
- CPU Power: 51W
- CPU Temp: 54°C
- Memory Usage: 13.4GB
- GPU Usage: 98%
- VRAM Usage: 7.2GB
- GPU Power: 133W
- GPU Temp: 60°C
In this mode, CPU usage is around 20%—7% higher than standard 4K. Memory usage is consistent with standard 4K. GPU nearly fully utilized, and VRAM usage slightly higher than standard 4K. Average FPS exceeds 60—an increase of over 18 FPS, or about 40% higher than 4K without DLSS. Minimum FPS is comparable to standard 4K. Frame time drops by about 6ms.
04
Conclusion
Overall, the GeForce RTX 5060 Ti 16GB performs quite well. Even at standard 4K with max settings, average FPS exceeds 40, delivering smooth gameplay. However, relying on a single game isn’t enough to claim that the 5060 Ti 16GB can smoothly run all 4K games—but DLSS does significantly boost performance.
Additionally, a clear pattern emerges: as resolution increases from 1080P to 1440P to 4K, CPU usage steadily declines, indicating that higher resolutions rely more on GPU power than CPU performance.
This is why previous processor comparison tests were conducted at 1080P—to focus on CPU differences. Testing at 4K would primarily reflect GPU capabilities, which would defeat the purpose of a CPU benchmark.

Disclaimer:
- This channel does not make any representations or warranties regarding the availability, accuracy, timeliness, effectiveness, or completeness of any information posted. It hereby disclaims any liability or consequences arising from the use of the information.
- This channel is non-commercial and non-profit. The re-posted content does not signify endorsement of its views or responsibility for its authenticity. It does not intend to constitute any other guidance. This channel is not liable for any inaccuracies or errors in the re-posted or published information, directly or indirectly.
- Some data, materials, text, images, etc., used in this channel are sourced from the internet, and all reposts are duly credited to their sources. If you discover any work that infringes on your intellectual property rights or personal legal interests, please contact us, and we will promptly modify or remove it.