The NVMe SSD has emerged as a prominent component in modern data centers, owing to its high throughput and ultra-low latency. Despite its popularity, the reliability of NVMe SSDs in large-scale deployments remains uncertain. This article presents a comprehensive analysis based on the logs collected from over a million NVMe SSDs deployed at Alibaba. The study reveals a range of significant reliability variations associated with NVMe SSDs. On the positive side, NVMe SSDs exhibit greater resilience to early failures and changes in access patterns. On the downside, they become more susceptible to complex correlated faults. Moreover, this study highlights the inherent risk of fault-slowdown events on NVMe SSDs due to their characteristic ultra-low latency feature.
Background and Motivation
NVMe SSDs have gained immense popularity as the new favorite in modern data centers. With bandwidth capabilities of up to 6GB/s and microsecond-level latency, NVMe SSDs offer significant performance enhancements over SATA-based counterparts. However, apart from performance, the reliability of any hardware deployed at a large scale is a crucial aspect to consider. While there is extensive research on failure characteristics of SATA SSDs in this field, their findings may not hold decisive significance for NVMe SSDs. Firstly, due to their low-latency interface, NVMe SSDs are particularly susceptible to fault-slowdown events. In essence, fault-slowdown events lead to abnormal performance degradation in the drive, such as higher latency under normal traffic. Unlike SATA SSDs, fault-slowdown events may be masked by relatively higher latencies (>100µs), whereas NVMe SSDs, with their ultra-low latency nature (∼10µs), are more susceptible to such impact. Furthermore, NVMe SSDs are not just SATA SSDs with interface upgrades. Instead, the internal architecture of NVMe SSDs has undergone significant changes. Vendors have also integrated a range of technologies to enhance the overall reliability of NVMe SSDs, such as independent NAND redundancy arrays (RAIN) or low-density parity-check codes (LDPC). Unfortunately, due to the lack of extensive research on large-scale NVMe SSD failure studies, the impact of recent advancements remains unknown.
DATA SET
① Data Collection
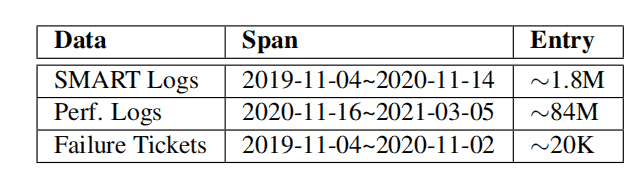
- SMART logs: In this study, reports on SMART attributes are collected daily within the cluster. The readings of these metrics can be either cumulative (e.g., media errors) or instantaneous (e.g., temperature). In practice, vendors may not necessarily adhere to precise counting or reporting mechanisms. Therefore, this article standardizes the numbers based on the manufacturer’s specifications.
- Performance logs: A major subset of the cluster is equipped with node-level daemons to monitor and record Linux kernel performance logs, including vital statistics of storage devices such as latency, IOPS, and throughput. Currently, the daemons run for three hours each day (from 9 PM to 12 AM) and record only the average values for each monitoring window (lasting 15 seconds). Within these three hours, the traffic remains relatively stable, reaching approximately 70% of peak load, predominantly driven by internal workloads and a smaller number of bursts from external clients.
- Failure tickets: Each node in the cluster is configured with a daemon to monitor and report stoppage failures. Upon reporting, a failure ticket is generated (manually reviewed by engineers), containing basic information about the affected drive (e.g., model and hostname) and timestamp.
② Overview
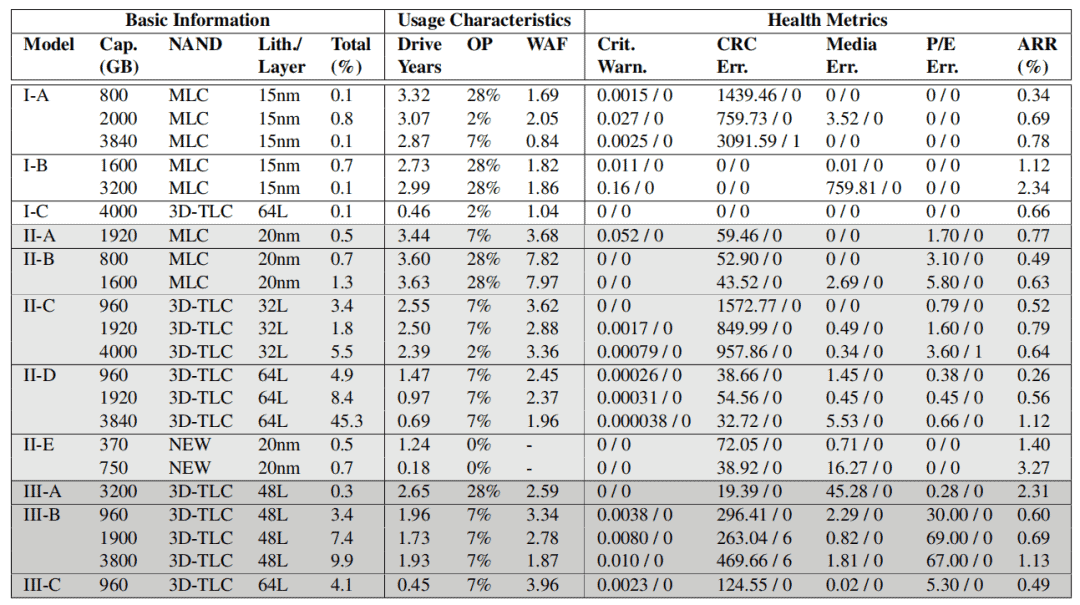
In the basic information, this article names the drive model as Manufacturer-Model and represents the generation of the manufacturer in alphabetical order (e.g., I-A represents the earliest model of Manufacturer I). Each model can be differentiated by capacity and NAND architecture. II-E is a unique case as it adopts a new type of cell (neither planar nor 3D stacked) and is thus named NEW (anonymous). Finally, the relative overall percentage (i.e., total %) is listed for each model.
Advanced management information is described using features. The first column represents the average power-on time calculated annually. The second and third columns represent the over-provisioning rate (OP) and the calculated average write amplification factor (WAF), respectively.
There are five key indicators related to reliability:
- Critical Warning: This severe warning, introduced by NVM, indicates that the drive may have significant media errors (i.e., operating in read-only or degraded mode), potential hardware failures, or exceeding temperature alarm thresholds.
- CRC Error: The number of transfer errors (e.g., interconnect failures between the drive and the host).
- Media Error: The number of data corruption errors (i.e., inability to access data stored in the flash media).
- Program/Erase Error: The number of flash unit programming errors (e.g., failure to program flash units from blocks that are about to be garbage-collected during the copy process).
- Annual Replacement Rate (ARR): The number of device failures divided by the device’s lifespan.
The readings of the first four health indicators exhibit significant bias, with zeroes accounting for the absolute majority of valid records (e.g., 99.97% for Critical Warning). Therefore, both the mean and median (i.e., mean/median) are provided concurrently.
③ Failure Tickets
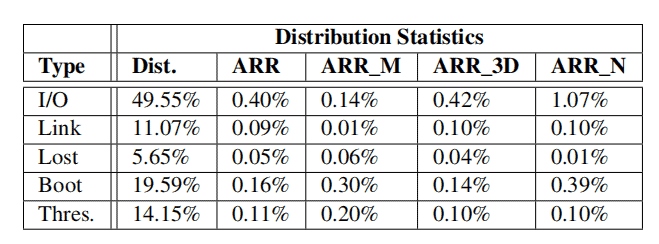
For each type of failure, the distribution (Dist) and corresponding ARR values are listed for all NVMe SSDs (ARR), MLC-based SSDs (ARR_M), 3D-TLC SSDs (ARR_3D), and NEW-NAND SSDs (ARR_N).
④ NVMe SSD vs. SATA/SAS SSD
In the dataset of NVMe SSDs (Checking and Maintaining SSD Health: A Complete Guide) within this study, the ARR (Annual Replacement Rate) is significantly higher compared to SATA/SAS SSDs from Netapp enterprise storage systems. The average ARR and median ARR for NVMe SSDs are 0.98% and 0.69%, respectively, which are 2.77 times and 2.83 times higher than SATA/SAS SSDs. The SSD population was further analyzed by NAND type and lithography technology, yielding similar results.
The Fail-Stop
① Infant Mortality
Discovery: Infant mortality, which refers to a failure trend during the early deployment phase of hardware, is not significant in NVMe SSDs.
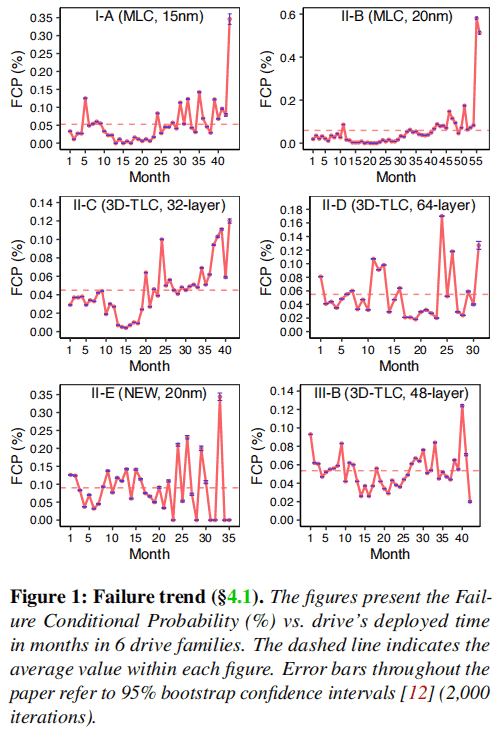
To support this conclusion, this article employs the monthly Failure Condition Probability (FCP) to illustrate the failure trend. FCP is calculated by dividing the number of drives replaced in a given month by the number of surviving drives in that month. Figure 1 presents the statistics for six popular families. Upon visual inspection, it can be observed that most families do not exhibit a significant infant mortality rate during the early stages.
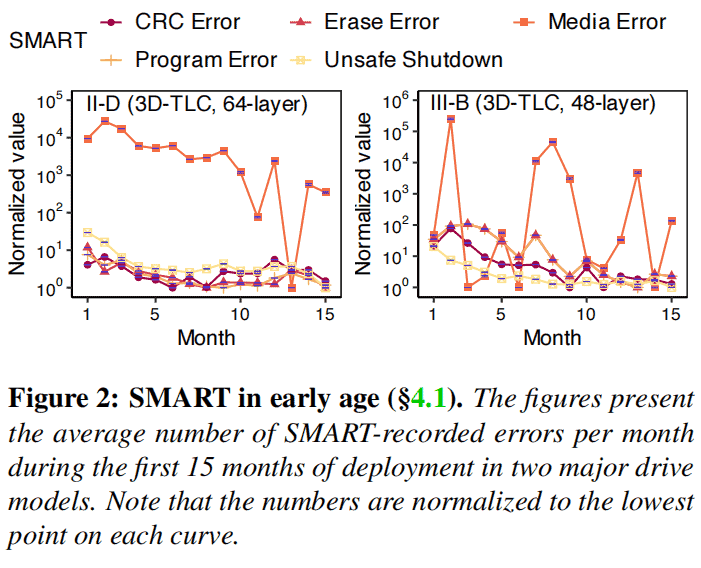
To further investigate the underlying reasons, this study continues to observe internal health indicators from the perspective of SMART attributes. For II-D and III-B in Figure 2, almost all health-related indicators undergo an infant mortality phase, starting from higher values and then declining over time to a stable range. Generally, other families also follow this trend. This suggests that even NVMe SSDs accumulate a significant number of errors in the early stages. Therefore, the study hypothesizes that improvements in FTL (Flash Translation Layer) error handling likely enhance the resilience of NVMe SSDs during the early phases.
The authors of this article believe that this finding can serve as a signal for relief to supply chain and on-site administrators, as previous practices often required cloud operators to store additional components before the initial deployment.
② WAF
Discovery: NVMe SSDs have become more robust against a high write amplification factor (WAF > 2), but extremely low write amplification (WAF ≤ 1) remains rare yet fatal.
Write amplification is a common phenomenon in SSD I/O, where additional data is written to NAND due to internal operations such as garbage collection and alignment. To overcome this drawback, manufacturers often utilize write compression techniques to consolidate small or repetitious writes in buffers. However, previous research has indicated that write compression techniques may lead to degradation when the failure rate of drives with WAF less than 1 is similar to those with WAF greater than 2. Hence, a similar statistical analysis was conducted in this study for NVMe SSDs.
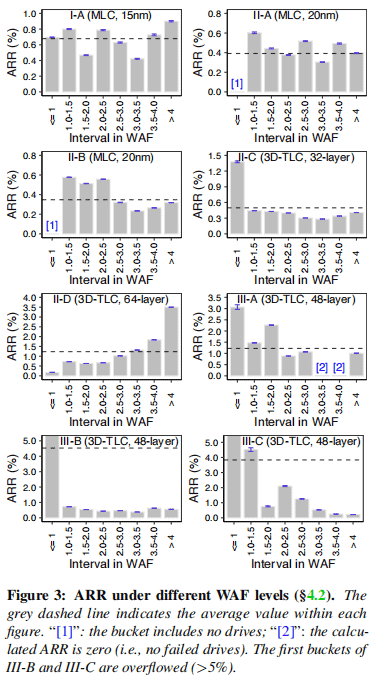
Figure 3 illustrates the correlation between WAF and failure rate for eight popular drive series, including different types of NAND and manufacturers. Firstly, for WAF values greater than 1, no strong positive correlation between WAF and ARR (Annual Replacement Rate) was observed in most drive families (with the II-D drive family being an exception). This suggests that NVMe SSDs are less affected by random small writes, which are the main cause of high write amplification. Secondly, for drives with low WAF (i.e., WAF ≤ 1), their failure rates remain relatively high. On average, the ARR rates for these low WAF drives could be 2.19 times higher than the average level.
Therefore, it can be concluded that in NVMe SSDs, although low WAF may still be fatal, high WAF is no longer a concern.
③ Node-to-node and intra-rack failures
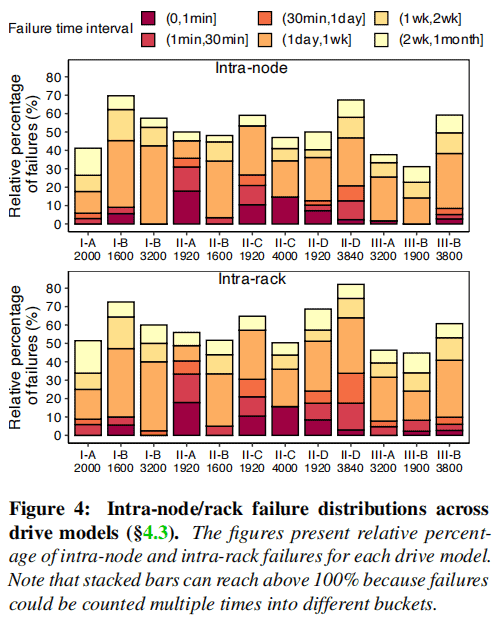
Discovery: Spatially correlated (node-to-node/intra-rack) NVMeSSD failures exhibit temporal dependency over longer time spans (i.e., 1 day to 1 month) but are no longer prevalent over shorter time intervals.
To investigate whether this correlation pattern still persists in NVMeSSD, this study examines the time intervals between node-to-node/intra-rack failures in the dataset. The Relative Failure Percentage (RFP) is used to calculate the likelihood of correlated failures. In RFP, the numerator refers to the number of failure sets occurring within a specific time window (e.g., 0 to 1 minute). The denominator is the sum of all failures for a particular drive model.
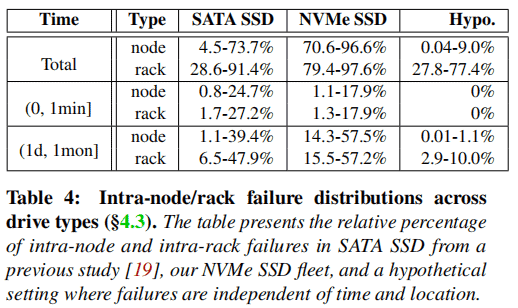
Table 4 and Figure 4 present the correlated failure patterns in NVMeSSD. Firstly, the cumulative RFP (i.e., Total Row) for all NVMe drive models is significantly higher, with an increase of 14.69× for intra-node and 1.78× for intra-rack scenarios compared to SATA SSDs. Secondly, unlike SATA SSDs that exhibit correlation primarily within short time intervals, correlated failures in NVMeSSD are typically observed within longer time intervals, ranging from 1 day to 1 month.
To ensure that these failures are indeed due to spatial-temporal correlations rather than natural averaging of failures within individual racks or nodes, the study conducted validation experiments by randomizing the device arrival times and physical locations in the dataset and retesting. The results, as shown in the highlighted “Hypo Load” row of the table, demonstrate a significant decrease in correlated failures within nodes and within time intervals, confirming the presence of this imbalance in failures.
While the decrease in closely correlated failures suggests a reduced risk of experiencing system-level failures, the significant increase in correlated failures within longer time intervals remains a pressing concern. An inconvenient reality is that the repair of drive failures typically begins with software-based methods such as data scrubbing and fsck, which require time for online checks and repairs. In fact, in the cluster studied in this paper, 43.90%, 14.36%, and 10.90% of failed drives were repaired after one day, one week, and two weeks, respectively.
Based on these findings, the paper proposes improvements to the operational process by directly taking drives offline to reduce the chance of enduring long-duration correlated failures.
The Fail-Slow
① Identifying fail-slow events and drives
In this study, the following threshold-based method was used to identify fail-slow drives, similar to previous research on SATA SSDs and HDDs.
The first step is to select suspicious drives with high latency. Performance records within the cluster, such as latency, IOPS, and throughput, typically follow a positively skewed distribution. For example, in a cluster, the median latency is only 49.19µs, while the average latency is 667.85µs. Therefore, a latency threshold of (-∞, 3rd_quartile + 2IQR) can be used to identify outliers (i.e., slow drives), where IQR (interquartile range) is calculated by subtracting the first quartile from the third quartile. If a drive’s 3-hour average latency exceeds the threshold, it is marked as a suspicious slow drive, while cases with high traffic are excluded to minimize false positives.
Next, we determine if the selected drives are indeed fail-slow by checking for a consistent slowdown. Suspected fail-slow drives are identified if, in events, their speed is at least twice as slow as their peers. This is assessed by comparing the slowdown ratios with a minimum span of 5, 15, 30, and 60 minutes, indicating comparisons of drive speed within these intervals with their peers. Table 5 shows the slowdown ratios, the percentage of drives identified as fail-slow in the model, and the frequency of events per hour per 1000 drives, which reflects the severity of fail-slow in a medium-sized cluster. The last two columns, Duration and Event Latency display the average duration and average event latency of fail-slow events. The final row in each quadrant represents the average for each category (e.g., SSD or HDD).
This method helps identify and analyze fail-slow events in NVMe SSDs, providing insights into their performance degradation and potential issues.

② SSD vs. HDD
Discovery: Failures in NVMe SSDs are more widespread and frequent compared to HDDs, resulting in performance degradation that can reach levels similar to or even lower than SATA SSDs or HDDs.
Comparison of average rows in each quadrant reveals that slow drives in SSDs range from 6.05× (i.e., 1.41% to 0.20% in the 5-minute quadrant) to 51× (i.e., 0.52% to 0.01% in the 60-minute quadrant). Similarly, the occurrence of fail-slow events (i.e., event frequency) is more common in SSDs, ranging from 18.59× (5 minutes) to 68.50× (60 minutes). Additionally, despite models like II-D-1920 and III-B-1900 still providing relatively satisfactory performance, fail-slow NVMe SSDs often exhibit latency levels comparable to SATA SSDs (averaging around 160µs). What’s worse, in several NVMe SSD models, the slowest 1% of events degrade to an average latency of approximately 22 ms, which is unsatisfactory even compared to HDD performance.
Root causes: The authors of this paper have sent back 100 of the slowest SSDs (approximately the top 2% identified as slow drives with an average event latency of 4.4 ms) to the vendors for repairs. The results reveal that 33 of them had faulty capacitors, leading to buffer failures and high latency. Among the remaining drives, 46 had bad chips, while the underlying causes for the rest of the chips remain unclear.
③ Differences between SSD models
Discovery: The manufacturer is the primary influencing factor in NVMe’s slow failure.
For the percentage of slow drives, there is a clear order across the four quadrants, with Manufacturer I followed by III and II. Even the highest value within III (e.g., III-b-1900 at 5-minute quadrant with 3.04%) falls significantly behind the models of Manufacturer I (e.g., I-A-2000 with 4.44%). This pattern also holds true for the comparison between III and II. However, we did not observe any visible patterns in terms of event duration, event latency, and slowdown ratio.
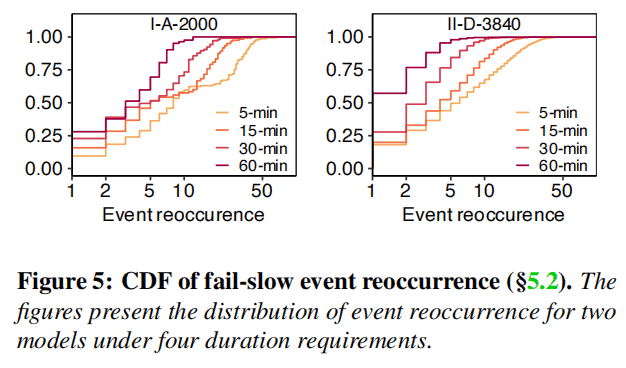
Discovery: A higher percentage of slow drives does not always result in a higher frequency of slow events.
One might assume that a higher percentage of slow drives would lead to a higher frequency of slow events. While this assumption holds true for the longest duration requirement (60-minute quadrant), several counterexamples were found in shorter quadrants (e.g., II-A-1920 and II-C-1920 in the 5-minute quadrant). One possible explanation is that, under shorter duration requirements, there are more drives with multiple events, resulting in a small proportion of slow drives but a high event frequency. This hypothesis is further supported by Figure 5, which shows the cumulative distribution function (CDF) of events per drive for different duration requirements. It is evident that drives with shorter durations accumulate more events compared to drives with longer durations.
④ Factors related to fail-slow incidents
Drive Age
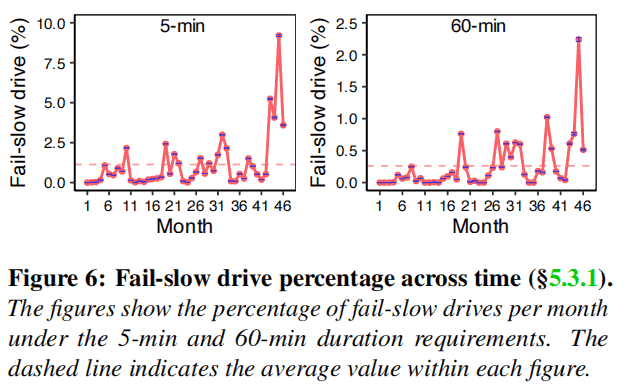
Discovery: The number of fail-slow drives and the event frequency are closely correlated with drive age, but only for older NVMessd drives (with power-on time greater than 41 months).
Figure 6 displays the population variance over time for both 5-minute (left) and 60-minute (right) requirements, with the horizontal dashed line indicating the mean value. It can be observed that in both cases, the population initially oscillates around the mean value and then starts to increase significantly in the last few months. Similar trends are also observed for the 15-minute, 30-minute, and 60-minute requirements.
Workload
Discovery: Workload can significantly impact various fail-slow characteristics, and heavy traffic workloads may have a long-term influence on the occurrence of fail-slow events.
This study evaluated the impact of workload by examining four representative cloud storage services with distinct access patterns: block storage, caching, object storage, and querying. Figure 6 illustrates the analysis by grouping the data based on age and program/erase (PE) cycle.
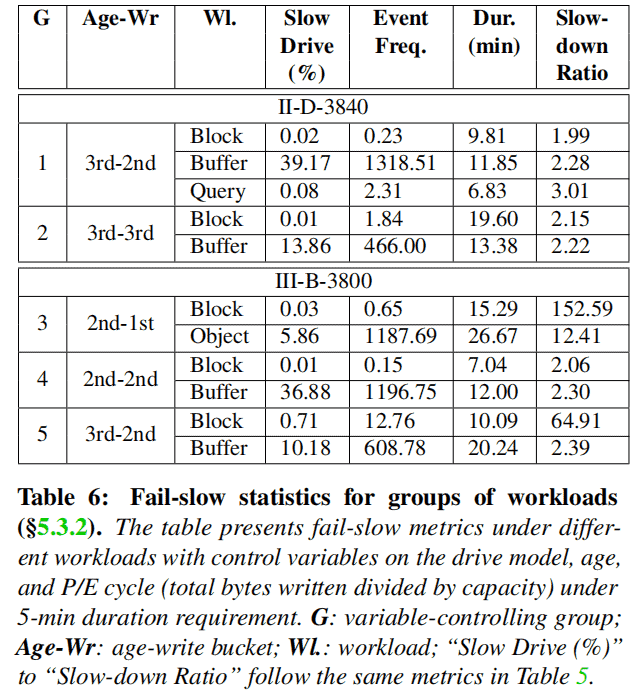
By comparing the metrics within each group, it can be observed that the workload can significantly impact all four fail-slow indicators. For example, in Group 1 and Group 2, the fail-slow population and event frequency for caching workloads may be thousands of times higher than that of block storage (e.g., 39.17% vs. 0.02% in Group 1). Similar differences can be observed in event duration and slowdown ratio between block storage and object storage in Group 3 or between block storage and caching in Group 5.
In practice, drives under caching workloads often experience a high volume of traffic (e.g., intermediate results of storage-intensive workloads). However, it should be noted that SSDs with heavy traffic have been excluded from the analysis. Therefore, a possible explanation is that heavy traffic workloads may have a long-term impact (e.g., causing data to be more dispersed) that makes drives more prone to fail-slow incidents.
SMART attribute
The study found that the correlation between SMART attributes and fail-slow indicators can be considered negligible. The effectiveness of automatic feature selection using WEFR (Weighted Ensemble Feature Ranking) was evaluated and compared with selecting features based on a fixed percentage (ranging from 10% to 100%). Figure 2 shows that the F0.5 score of WEFR is always higher than or equal to the highest F0.5 score achieved using a fixed percentage of selected features. Specifically, the percentages of selected features determined by WEFR for the six drive models (MA1, MA2, MB1, MB2, MC1, MC2) were 31%, 34%, 28%, 26%, 63%, and 28% respectively. These percentages were close to the percentages of selected features corresponding to the highest F0.5-score when determining the fixed percentage of selected features. It is worth noting that using automatic feature selection through WEFR offers more flexibility compared to selecting a specific percentage of features through manual tuning in production environments.
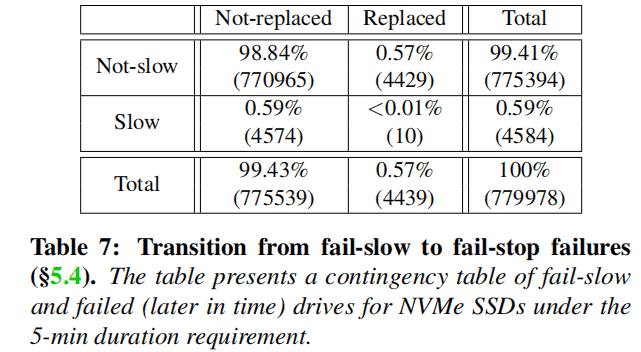
⑤ Fail-slow to fail-transfer
Discovery: The transition from fail-slow to fail-stop is rarely observed, and no instances were observed within a short time interval of 5 months.
Table 7 is an example contingency table that records the frequency count of drives based on two categories: appearing in the failure log (replaced column) or not appearing (not replaced column), considering at least one fail-slow event (slow rows) or not (non-slow rows). The results are quite surprising, as only 10 drives experienced fail-stop failures before the fail-slow failures. The numbers are relatively small in both the slow drives (approximately 0.22%) and the replaced drives (approximately 0.23%). The average and median transition times were 73 days and 67 days, respectively. One possible reason is that fail-stop failures are rare, or it may take a significant amount of time for the transition from fail-slow to fail-stop. Therefore, we conclude that the transition from fail-slow to fail-stop is unlikely to occur, at least within a few months.