According to the annual report from NOAA’s Global Monitoring Laboratory, the global average atmospheric carbon dioxide concentration reached a record high of 419.3 parts per million (ppm) in 2023. Between 2022 and 2023, the concentration increased by 2.8 ppm, marking the 12th consecutive year with a rise of more than 2 ppm.
Modern records of atmospheric carbon dioxide levels began with observations at the Mauna Loa Observatory in Hawaii. The graph displays monthly average carbon dioxide measurements in parts per million (ppm) from the station since 1958. Vegetation growth in the Northern Hemisphere in summer decreases atmospheric carbon dioxide, while decay during winter increases it.
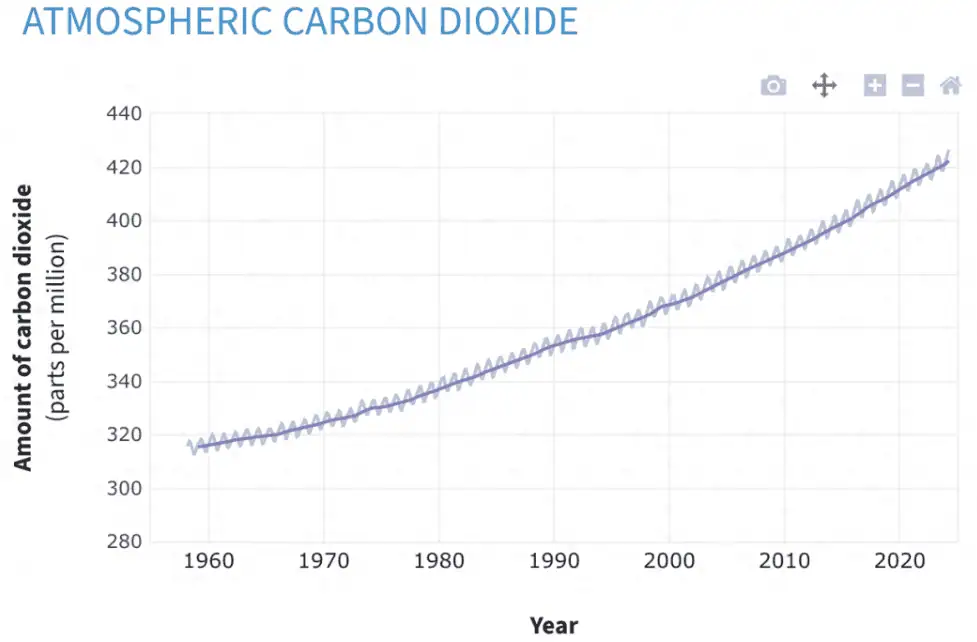
The long-term trend of rising carbon dioxide levels is caused by human activities. At Mauna Loa, the peak monthly value occurs in May each year. In May 2023, the carbon dioxide concentration reached 424 ppm, setting a new record.
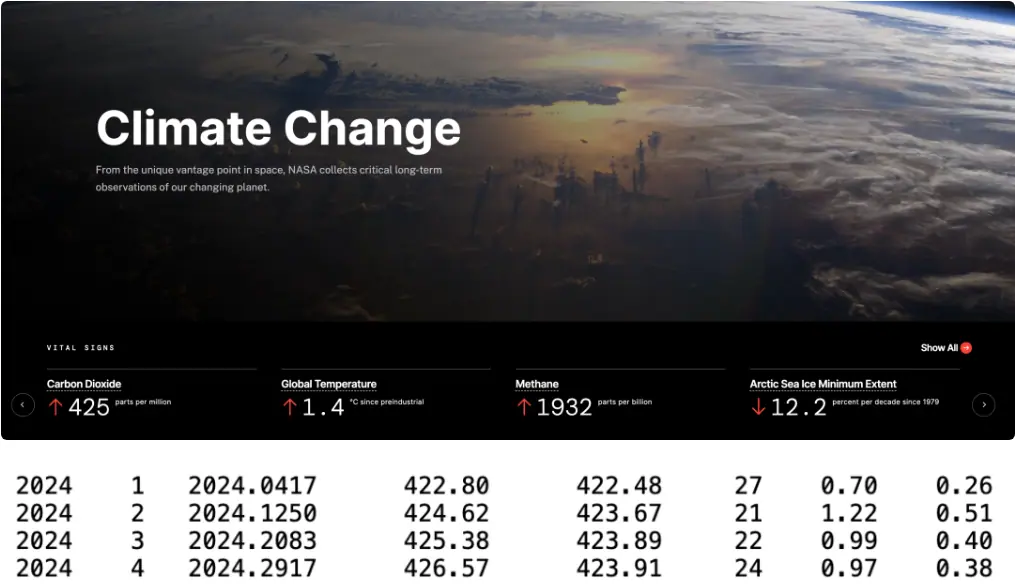
According to NASA data, the average carbon dioxide concentration in April 2024 was 426.57 ppm.
The rise in carbon dioxide concentrations is primarily due to the burning of fossil fuels for energy. Fossil fuels like coal and oil contain carbon that plants have absorbed from the atmosphere through photosynthesis over millions of years; we can return this carbon to the atmosphere in just a few hundred minutes. Since the mid-20th century, the annual emissions from burning fossil fuels have increased every decade. According to the “2023 Global Carbon Budget,” annual carbon dioxide emissions have grown from nearly 11 billion tons in the 1960s to an estimated 36.6 billion tons in 2023.
In the 1960s, the global atmospheric carbon dioxide growth rate was about 0.8±0.1 ppm per year. Over the next half-century, the annual growth rate doubled, reaching 2.4 ppm per year in the 2010s. Over the past 60 years, the annual growth rate of atmospheric carbon dioxide has been about 100 times faster than the natural rates observed during the end of the last Ice Age, about 11,000-17,000 years ago.
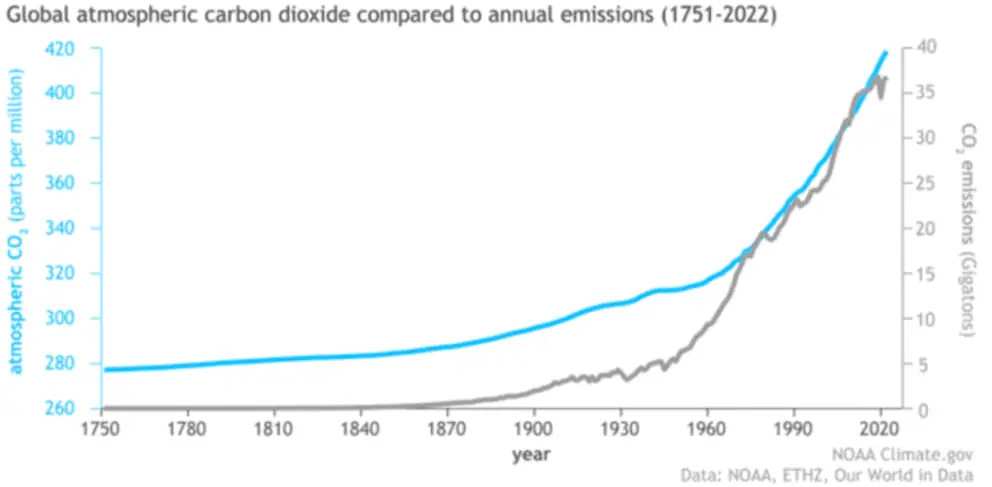
Since the start of the Industrial Revolution in 1750, the concentration of carbon dioxide in the atmosphere (represented by the blue line) has increased along with human emissions (represented by the grey line). In the mid-20th century, emissions slowly rose to about 5 billion tons per year (1 billion tons equals 1 gigaton), and by the end of this century, emissions skyrocketed to more than 35 billion tons per year.
01
Why is Carbon Dioxide Important?
Carbon dioxide is the most important greenhouse gas on Earth: a gas that absorbs and radiates heat. Unlike oxygen or nitrogen (which make up the main components of our atmosphere), greenhouse gases absorb heat radiated from the Earth’s surface and re-emit it in all directions—including back to the Earth’s surface. Without carbon dioxide, Earth’s natural greenhouse effect would be too weak to maintain the global average surface temperature above the freezing point. By emitting more carbon dioxide into the atmosphere, humans are accelerating the natural greenhouse effect, leading to a rise in global temperatures.
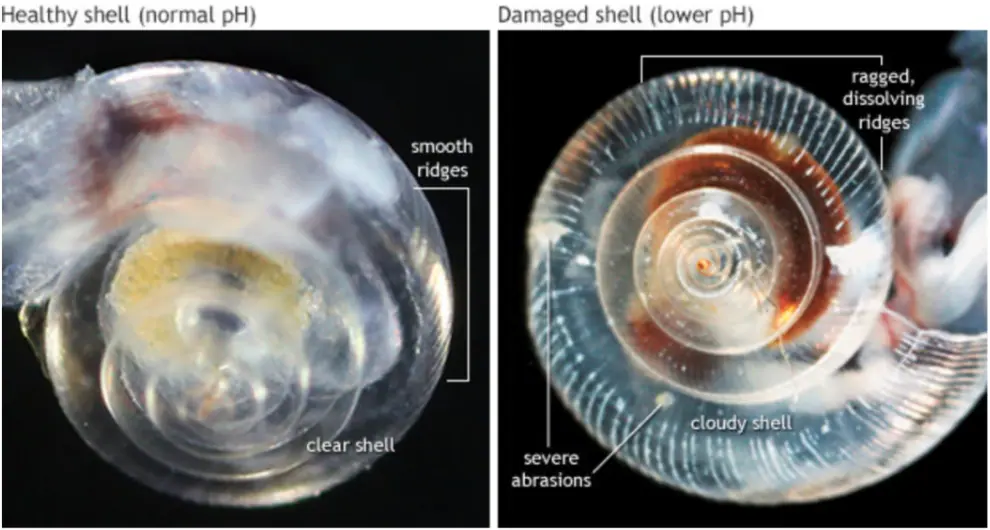
Another reason carbon dioxide is important in the Earth’s system is that it dissolves in the ocean like bubbles in soda water. It reacts with water molecules to produce carbonic acid and lowers the ocean’s pH value (increasing its acidity). Since the start of the Industrial Revolution, the pH value of the ocean’s surface water has dropped from 8.21 to 8.10. This decrease in pH is referred to as ocean acidification.
02
The Past and Future of Carbon Dioxide
Over the past million years or longer, natural increases in carbon dioxide levels have periodically caused Earth’s temperature to rise. The onset of warm periods (interglacials) begins with a slight increase in sunlight reaching the Northern Hemisphere due to changes in Earth’s orbit around the Sun and its axial tilt. As the oceans warm, they release carbon dioxide—similar to how a can of soda goes flat on a hot summer day. The additional carbon dioxide in the atmosphere greatly amplifies the initial warming driven by the Sun.
According to bubbles captured in mile-thick ice cores and other paleoclimate evidence, we know that during the past several million years of glacial cycles, atmospheric carbon dioxide levels never exceeded 300 parts per million (ppm). Before the start of the Industrial Revolution in the mid-18th century, atmospheric carbon dioxide levels were 280 ppm or less.
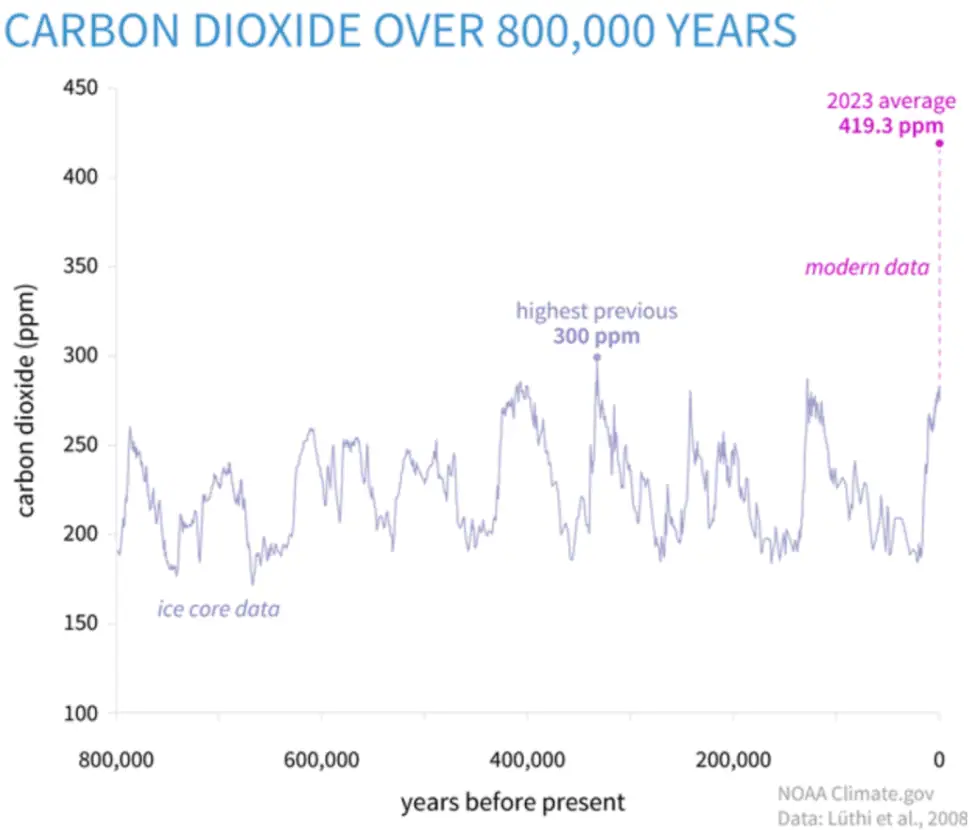
Based on ice core data (light purple line), compared to the concentrations in 2022 (bright purple dot), the parts per million (ppm) of carbon dioxide (CO2) in the atmosphere over the last 800,000 years. The peaks and troughs of this line display the ice ages (low carbon dioxide) and warmer interglacials (high carbon dioxide). During this period, carbon dioxide levels never exceeded 300 ppm (light purple dot, between 300,000 to 400,000 years ago). The rate of increase over the past 60 years has been 100 times faster than any natural rate in the past. Indeed, on a geological time scale, the increase from the end of the last ice age to the present (purple dashed line) appears almost instantaneous.
By 1958, when continuous observations began at the Mauna Loa Observatory, the global atmospheric carbon dioxide level had already reached 315 ppm. Today’s carbon dioxide levels are higher than at any time in human history. The last time atmospheric carbon dioxide levels were this high was about 3 million years ago during the mid-Pliocene warm period when global surface temperatures were 4.5-7.2 degrees Fahrenheit (2.5-4 degrees Celsius) higher than pre-industrial levels. Sea levels were at least 16 feet (4.87 meters) higher than in 1900, and possibly as high as 82 feet (25 meters).
If global energy demands continue to grow rapidly, and we primarily rely on fossil fuels to meet these demands, then by the end of this century, annual human emissions of carbon dioxide could reach 75 billion tons or more. The atmospheric carbon dioxide level could reach 800 ppm or higher—a condition not seen on Earth in nearly 50 million years.
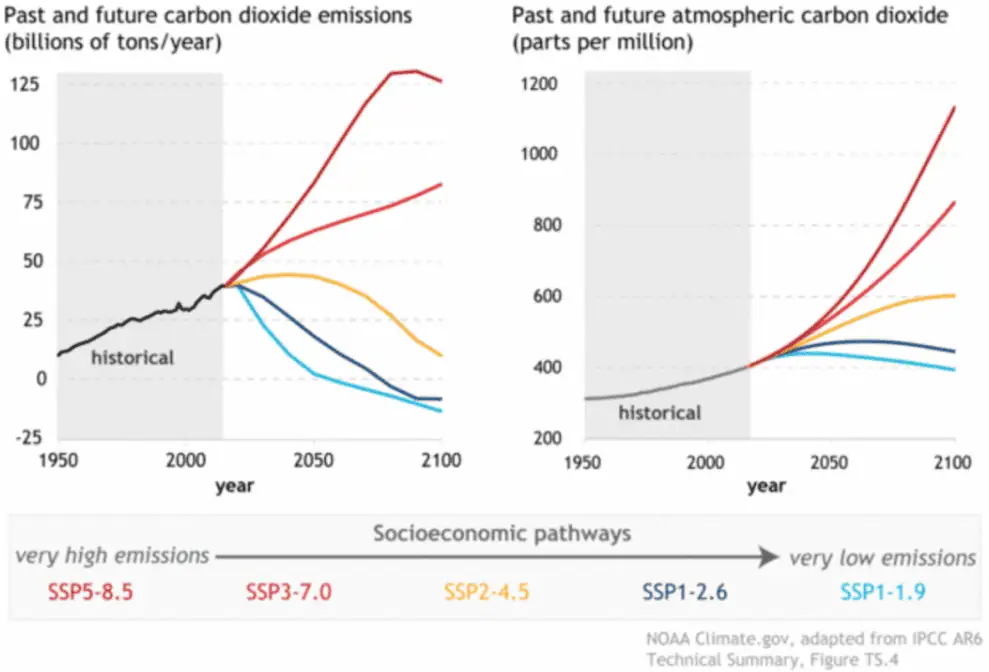
Projected annual carbon dioxide emissions (left) and resulting atmospheric carbon dioxide concentrations (right) by the end of this century under possible socioeconomic pathways. Shared socioeconomic pathways are a set of internally consistent assumptions about future population growth, global and regional economic activity, and technological advances. Models use these pathways to predict a range of possible future carbon dioxide emissions; for simplicity, the image only shows the average.
Source: NOAA Climate
Related:
- 3 Top Smartphone Trends of 2025 You Must Know
- Pollution Of The Environment By Waste Electronic Components
- The environmental problems behind the semiconductor workshop

Disclaimer: This article is created by the original author. The content of the article represents their personal opinions. Our reposting is for sharing and discussion purposes only and does not imply our endorsement or agreement. If you have any objections, please contact us through the provided channels.