From SLC and MLC to TLC and even today’s QLC, technological iterations have resulted in ever-increasing NAND storage densities and lower operational costs per GB. Nowadays, enterprise NVMe SSDs of a few terabytes or even a dozen are becoming mainstream, but on the other hand, the erasable lifespan of the NAND cell is getting shorter and shorter, which has led to many discussions about SSD longevity.
▮ What’s the SSD lifetime?
The endurance of an SSD refers to the amount of data that is written during the lifetime of an SSD. Increasing the user capacity of SSD and choosing NAND particles with higher erase times are effective measures to extend SSD lifespan. At the same time, it also requires that the other hardware and software (firmware) of the SSD are not weak.
An enterprise-class SSD must ensure the consistency of its key indicators throughout its lifecycle under various complex loads and external environments. It requires the product to be designed with full consideration of complex and diverse user scenarios and to meet the specified durability and reliability indexes in functional design, circuit design, component selection, firmware algorithm, and other aspects. Although NAND endurance is one of the factors affecting SSD endurance, it is not the same as NAND endurance.
▮ Why is NAND longevity such a concern?
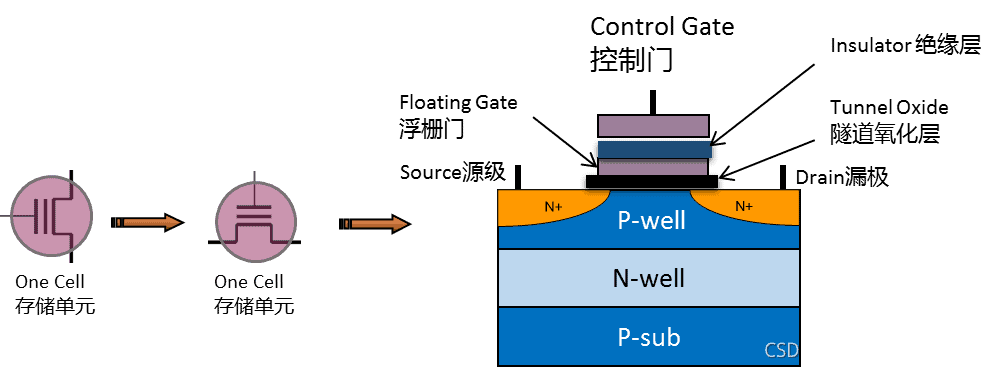
Regardless of SLC, MLC, or TLC, they all use quantum mechanical tunneling, adding a high programming voltage to the control gate, allowing electrons to flow through the tunnel oxide layer to the floating gate and accumulate in the floating gate to store information. Erasing still uses tunneling to reverse the voltage to remove the electrons in the floating gate and achieve the result of erasing the information. In the repeated crossing of electrons. , the tunnel oxide layer causes irreversible wear, so it can no longer effectively hold the load on the floating gate and eventually fails.
NAND Lifetime Quantification Index is P/E Cycles, ie the amount of program/erase that consumes 1 P/E of NAND. Depending on the NAND vendor, NAND must meet the following characteristics before the price-to-earnings ratio is exhausted:
- NAND maintains the required RBER (Raw Bit Error Rate) at normal operating temperatures.
- The number of good blocks remaining in the NAND can still meet its parameter specifications.
- The temperature sensitivity can still meet the usage requirements.
- The resistance to data readout disturbances still meets the requirements.
- The performance parameters of the original read/write design still meet the requirements
- …………
The P/E frequency of SLC NAND is up to 100,000, MLC is around 3,000, that of TLC NAND for general consumers is around 500~1,000, and that of Enterprise eTLC is much higher, typically around 5,000~10,000 Die SSD user capacity will not increase geometrically, the number of P/E times available for NAND will be reduced, users’ concerns about SSD lifespan will naturally increase.
▮ Causes of increased NAND depletion
If I have 1TB of SSD capacity and 1,000 P/E times available, does that mean my SSD will die while writing my 1,000TB of data? Unfortunately, that’s not the case, and it’s even worse than you think. Write amplification is the main cause of this problem.
According to the working principle of NAND, it writes data on the side drive and erases data on the block drive. When new data is written, the write position needs to be erased first instead of directly overwritten like HDD. Since a block contains multiple pages, valid data must be preserved and then written to before it is deleted, which is garbage collection (GC) and write amplification (WA). In other words, once a user writes data, there could be two or three. Sometimes the data will actually be written to the SSD, which will surely increase the P/E consumption of NAND.
Enterprise applications have very different workloads that trigger different write amplification. In the hard disk write endurance test, we generally use three typical load models: sequential, purely random 4K, and IO model defined in JESD219, and introduce the concept of WAF (Write Amplification Factor).
WAF = The actual number of Nand writes / Amount of user data written
| Workloads | Sequence | 4K Random | JESD219 |
|---|---|---|---|
| IO Features | Sequential I/O is a sequence of requests to access contiguous blocks of data such that the block is fetched during GC, requiring very little additional data movement (writing) and less WAF. | 4K Random IO is a sequence of requests for access to non-contiguous blocks of data. Data distribution is patchy, so more extra data movements (writes) are required during GC and WAF is average. | The workload defined by the JEDEC Solid State Technology Association in the JESD218 standard is dominated by small 4K IO blocks accounting for 67% of hits, 512 bytes 10 accounting for 4%, and a combination of different 10 weight distributions such as 1K, 8K, 16K, 32K, with the highest WAF. |
| WAF | ≈1, minimum | Medium | Max |
As shown above, the WAF for sequential writes is the smallest, approximately 1 (actual write volume is approximately equal to the user’s write volume). However, since there are few purely sequential workloads in real business scenarios, writing measured lifetimes is not really feasible. Random 4K seems reasonable but differs from the real scenario as it contains no less than 4K I/O. JESD219 tests and simulates the real business situation of enterprise users and brings the industry benchmark standard for SSD write load testing. It contains a mix of I/O distributions with different weights from 512 bytes to 64 KB, and those less than 4K I/O will grow to bring a writing boost.
In addition, JESD219 also defines hot and cold data according to the characteristics of the enterprise-class I/O model to enable wear leveling and introduce additional data movements. For this reason, SSD writing and playback under JESD219 is higher than pure 4K random load.
Different test methods lead to different prediction results for SSD lifespan. The higher the WAF, the more referential the results are. For example, a typical enterprise-class SSD on the market can achieve a DWPD of 5 (the number of total writes per day over the lifetime of the disk) under a purely sequential workload and a DWPD of 1 under a defined load JESD219.
For DiskMFR enterprise SSDs, 5-year DWPD and PBW endurance were tested under the JESD219 workload. Obviously, such a test standard is more in line with real usage scenarios of business users and has more reference value.
| Workloads | Sequence | 4K Random | JESD219 |
|---|---|---|---|
| WAF | ≈1, Minimum | Medium | Max |
| DWPD/5 years | 6.7 | 1.6 | 1.5 |
▮ Can P/E Cycles be promoted?
There is no good way to increase the number of erasable P/E times for NAND other than using techniques to make the NAND as reliable as possible before the P/E is exhausted.
For data error correction, the NAND factory provides the iteration table for changing parameters such as the reference voltage for reading data and is ready for use by the SSD module factory. For those cooperative enough, internal commands can even be given to further adjust the placement of each channel for further data error correction.
NAND aging is not transmitted by external will. P/E cycles, as their name suggests, refer only to the “program” and “erase” actions. Improving P/E cycles by optimizing read voltage is consistent. rather untenable. Each generation of NAND products from the original factory has been verified for a long time and obtained the appropriate parameters to be solidified into NAND products for market applications. SSD manufacturers can optimize all algorithms and technologies related to writing amplification, but cannot exceed the maximum value of P/E cycles.
When the P/E cycles reach the maximum point of the manufacturer’s commitment, the SSD will be terminated. At this point, you may still be able to read and write to the SSD, but it’s likely that one of your notification flags was “organ failure”. “The most obvious performance fell sharply, data maintainability increased data error rates, the problem like data corruption or loss, such concerns are difficult to get only through the read and write test. In this case, the SSD does not have reliable characteristics. Therefore, it is not recommended to continue to use the SSD.
▮ What about SSD lifetime? PBW and DWPD
There are two types of SSD life units, PBW (or TBW) and DWPD:
- PBW (or TBW): Petabytes Written (or Terabytes Written) indicates the amount of data Written on hosts during the SSD lifetime. 1PBW = 1000TBW
- DWPD: Drive Writes Per Day, the number of Writes allowed Per Day during the life of an SSD.
DWPD and PBW/TBW can be converted to each other by the following formula:
DWPD = TBW / (SSD User Capacity: Unit TB) * 365 * Quality assurance number
Assuming an SSD has a user capacity of 3.2TB and a DWPD of 3.4 after 5 years, its TBW is 3.2TB × 3.4 × 365 × 5, or 19,856TB.
The calculation of DWPD depends on the lifespan of the hard drive. For enterprise SSDs, the five-year warranty period is generally used as a reference. For example, the DiskMFR Enterprise SSD has 3.4 DWPD writes per day, which translates to a 5-year lifespan. If this SSD only works for 3 years, it can reach 5.7 DWPD per day.
▮ What is the relationship between SSD lifetime and MTBF?
The lifetime indicates how long the SSD can be used. The mean time between failures (MTBF) indicates whether the SSD is reliable over its lifetime. During the life cycle of the SSD, its reliability performance must always meet industry standards (e.g. an enterprise SSD must keep user capacity unchanged, UBER ≤ 10E-16, FFR ≤ 3% and data can be preserved for 3 months at 40°C at room temperature after power failure). When the lifespan of the SSD is exhausted, i. H. the maximum number of P/E times is reached, the reliability of the SSD deteriorates significantly.
Whether PBW, TBW, DWPD of SSD lifespan, or MTBF Reliability Index of SSD, they relate to the actual availability of the hard drive and affect the users’ end usage. SSD manufacturers must put themselves in the users’ shoes, simulate real-world user usage scenarios, and use conservative quantification to ensure organizations and individual users are making the right decisions.
END.